On a related note, for questionnaire analysis check-out my repo under https://github.com/MohamedKari/questionnaire-analysis.
Problem Setup
“The purpose of a repeated measures designs is to determine the effect of different experimental conditions on a dependent variable” (Rutherford 2001, p. 61) from measures taken on the same subject under these different conditions.
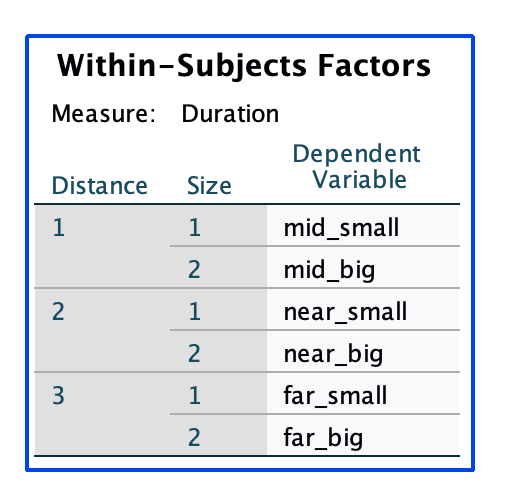
Let’s assume we follow a within-subject design, measuring the dependent variable “Duration” (or the mean of Duration across multiple repetitions) across 7 different participants under the the independent variables “Distance” and “Size”. Distance has 3 levels: “Far”, “Mid”, “Near”. Size has 2 levels: “Big”, “Small”. This results in 3x2=6 different conditions.
Let’s assume our trial data is in a table of the following form:
ParticipantId,Distance,Size ,Duration
1            ,near    ,small,2060.770833333333
1            ,near    ,big  ,2816.020833333333
1            ,far     ,small,4552.916666666667
1            ,far     ,big  ,5382.895833333333
1            ,mid     ,small,1847.0625
1            ,mid     ,big  ,2052.3125
2            ,near    ,small,1802.5208333333333
2            ,near    ,big  ,2169.0
2            ,far     ,small,2743.2291666666665
2            ,far     ,big  ,2159.1041666666665
2            ,mid     ,small,1923.56
2            ,mid     ,big  ,1749.42
3            ,near    ,small,1635.8333333333333
3            ,near    ,big  ,2204.785714285714
3            ,far     ,small,3470.673076923077
3            ,far     ,big  ,2937.096153846154
3            ,mid     ,small,1876.0238095238096
3            ,mid     ,big  ,1846.071428571429
The table should have 7 participants x 6 conditions = 42 rows. It should have 4 columns: 1 column for participant ID, 1 column for the depedendent variable and one column for each independent variable.
Tooling
Running a Multi-Factor ANOVA in SPSS
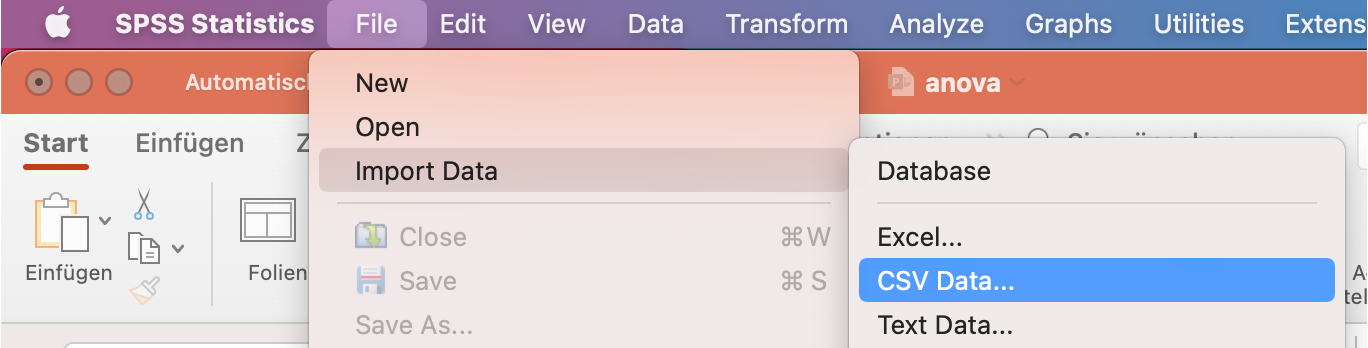
Data Preparation
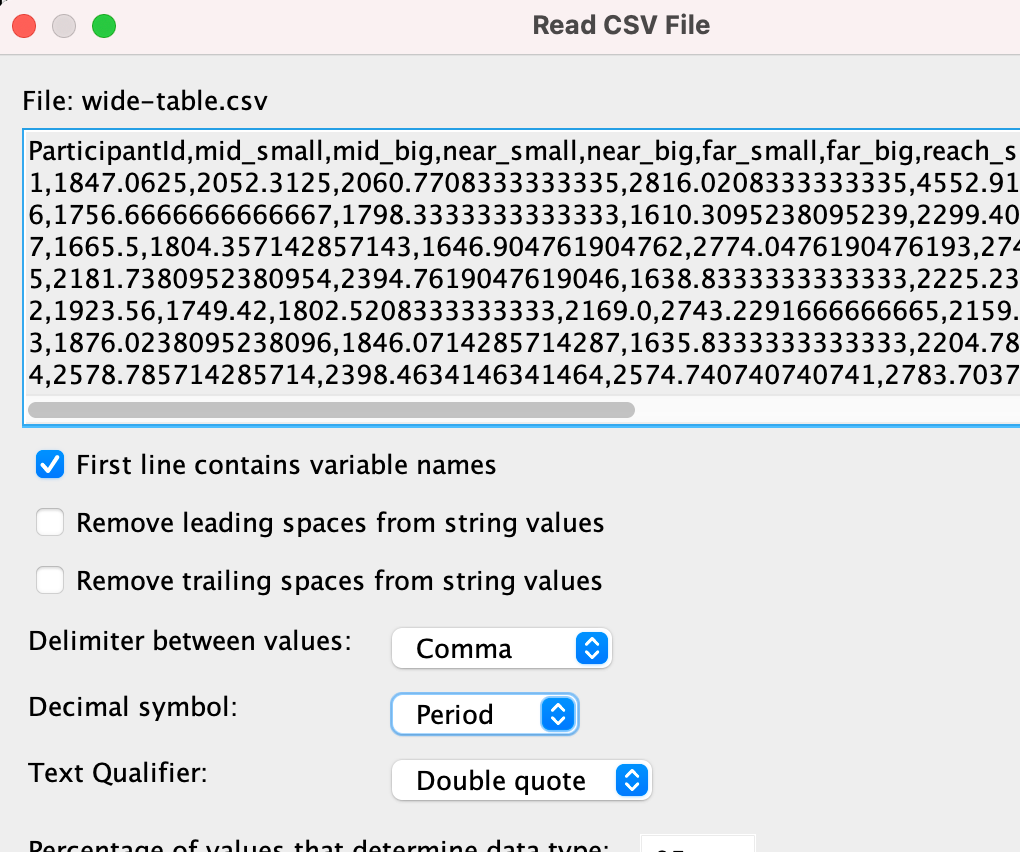
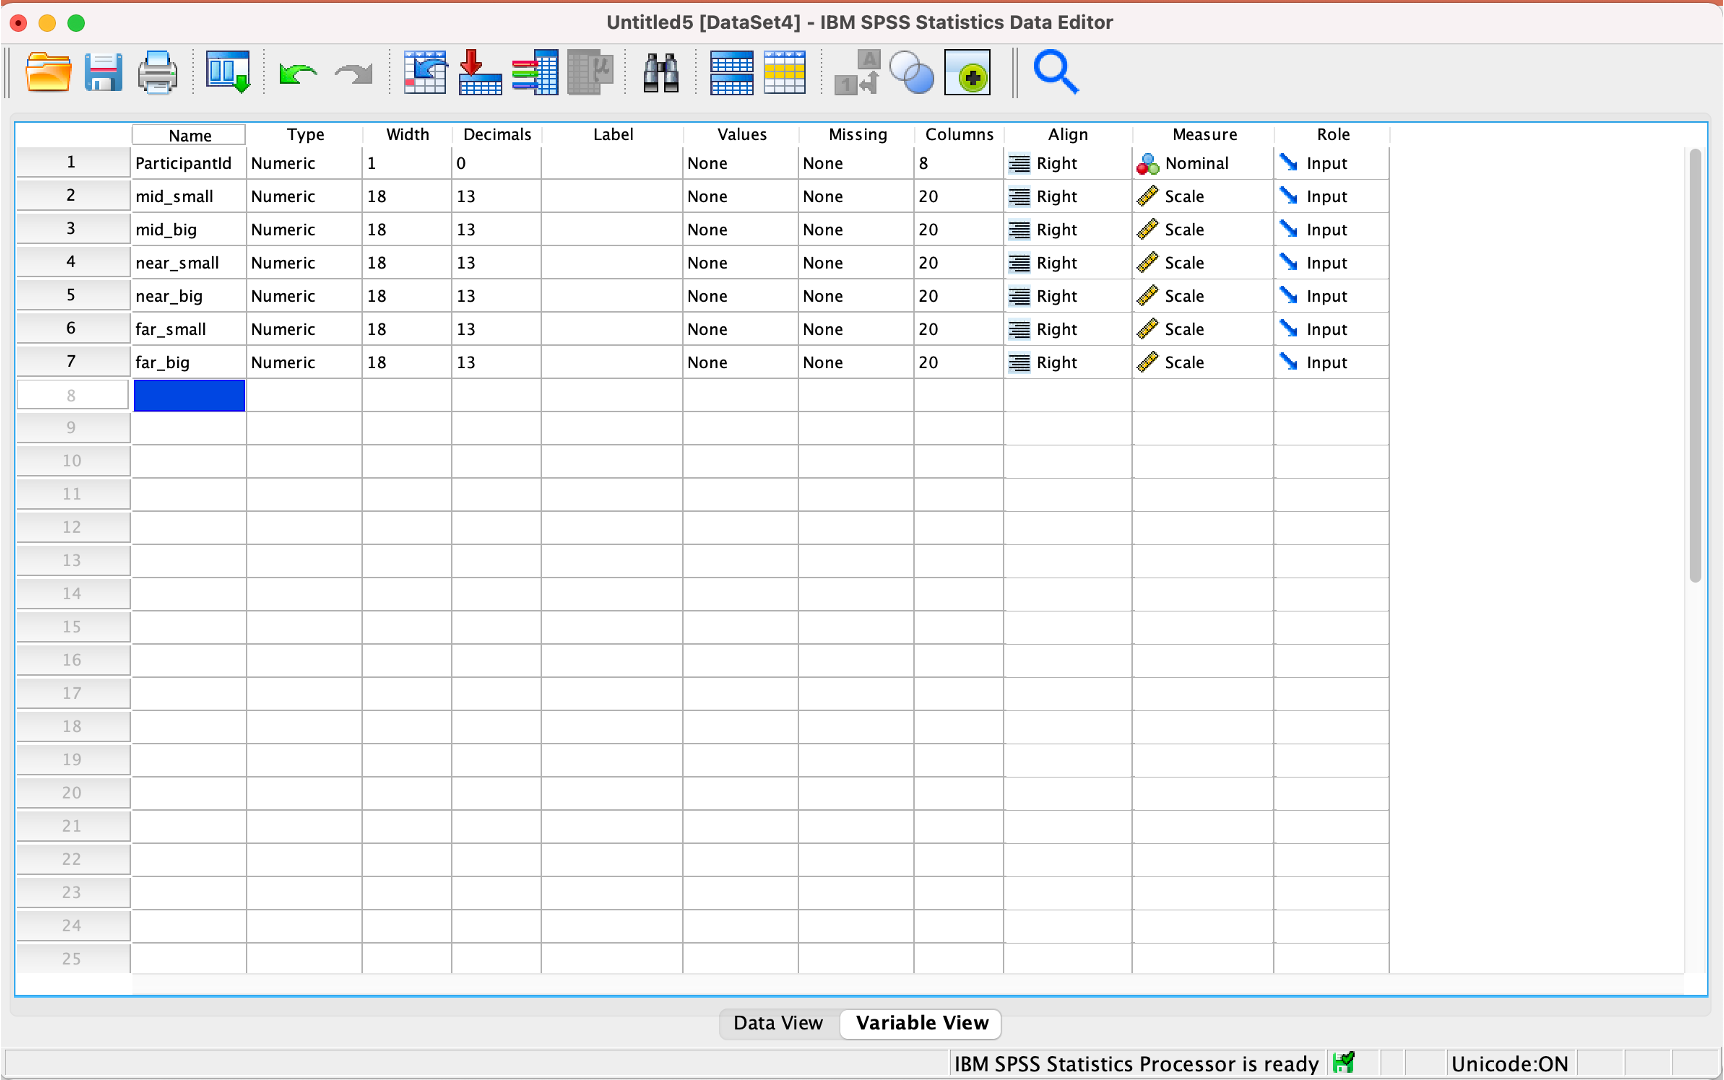
In order to run the analysis in SPSS, we need to create a table in Wide-Column Format, where each of the 6 conditions is represented by a column, each of the subjects is represented by a row, and the measurement of the dependent variable is given in the resulting cells:
ParticipantId,mid_small         ,mid_big           ,near_small        ,near_big          ,far_small         ,far_big           ,reach_small       ,reach_big
1            ,1847.0625         ,2052.3125         ,2060.7708333333335,2816.0208333333335,4552.916666666667 ,5382.895833333333 ,3583.0            ,3509.9375
6            ,1756.6666666666667,1798.3333333333333,1610.3095238095239,2299.404761904762 ,2845.609756097561 ,2878.829268292683 ,2092.5714285714284,2827.714285714286
The table should have 7 participants = 7 rows, and 6 conditions + 1 column for the participant id = 7 columns.
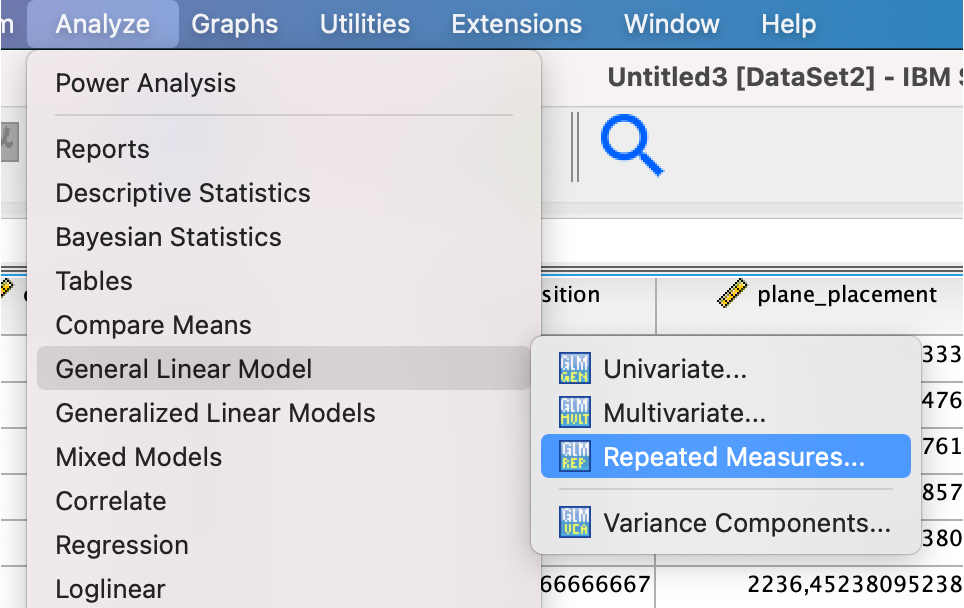
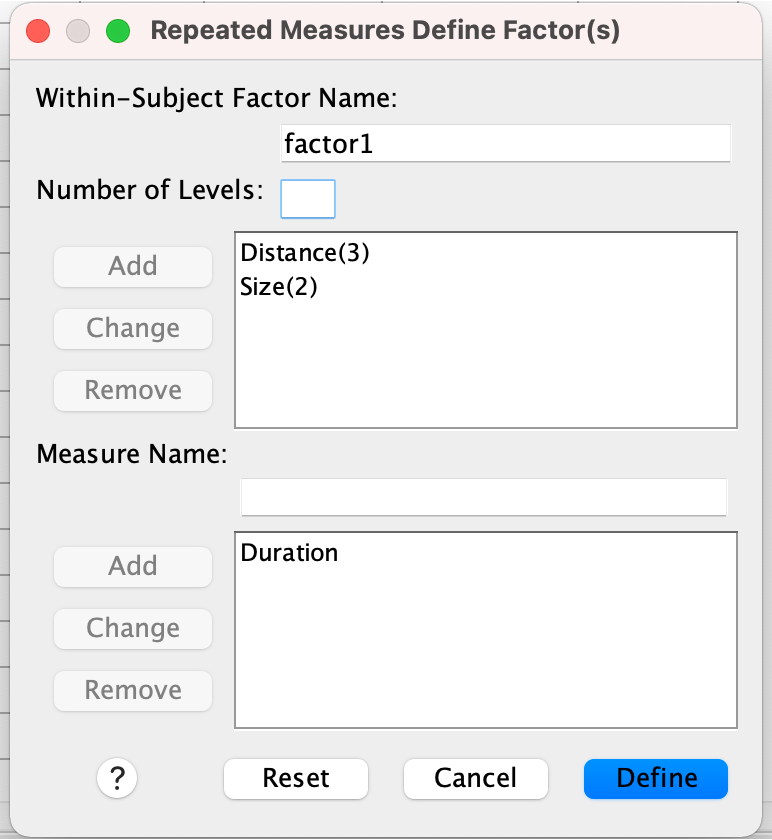
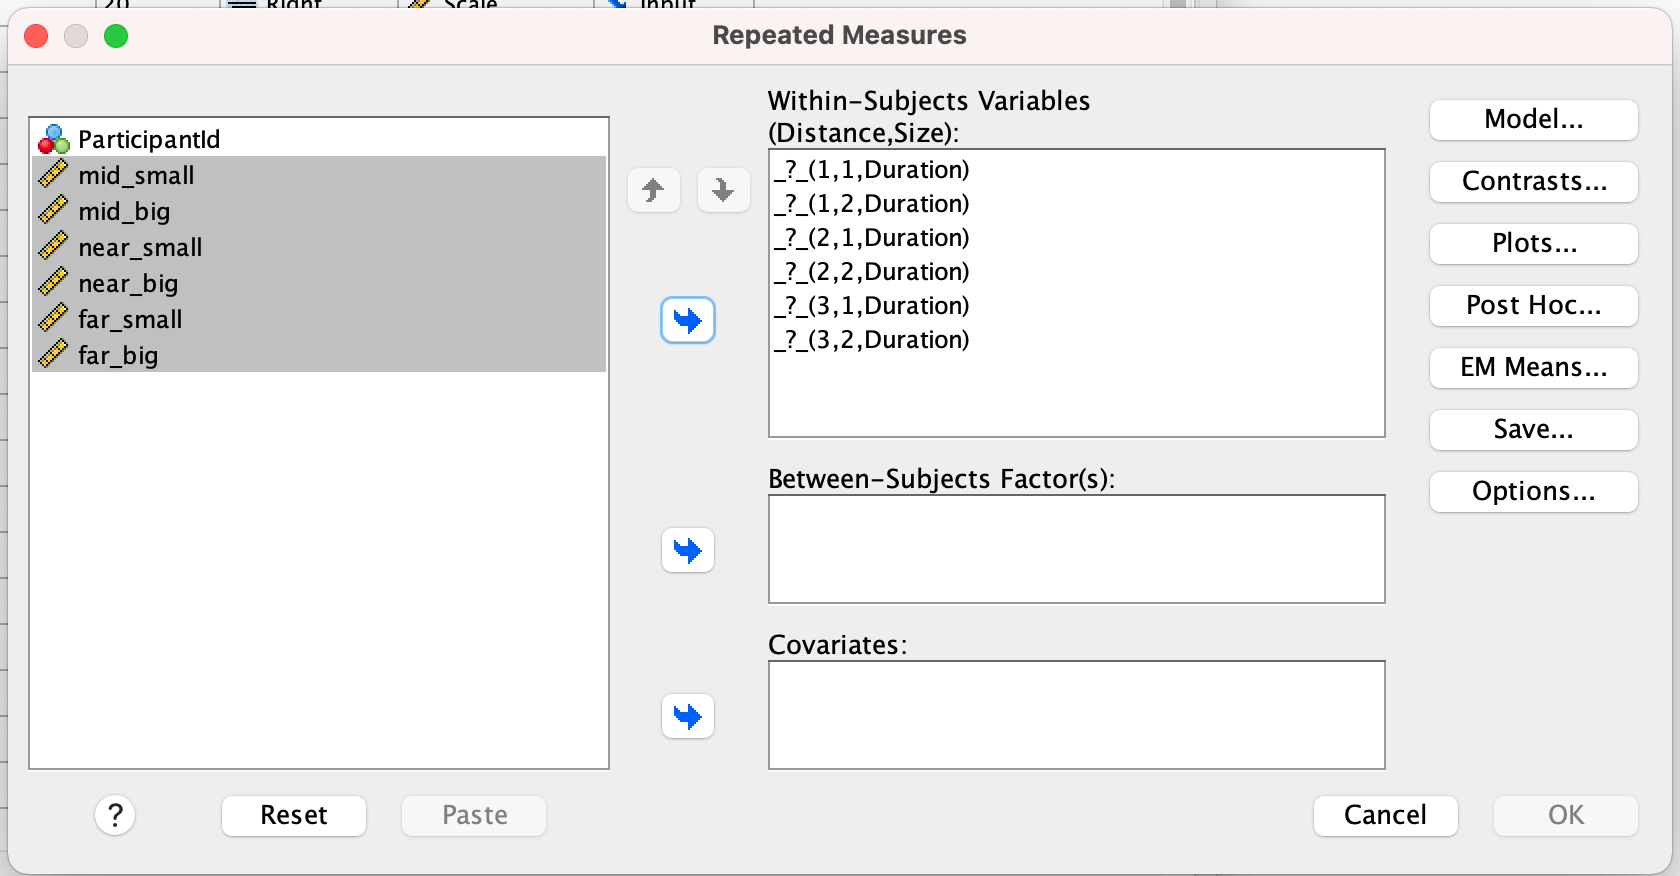
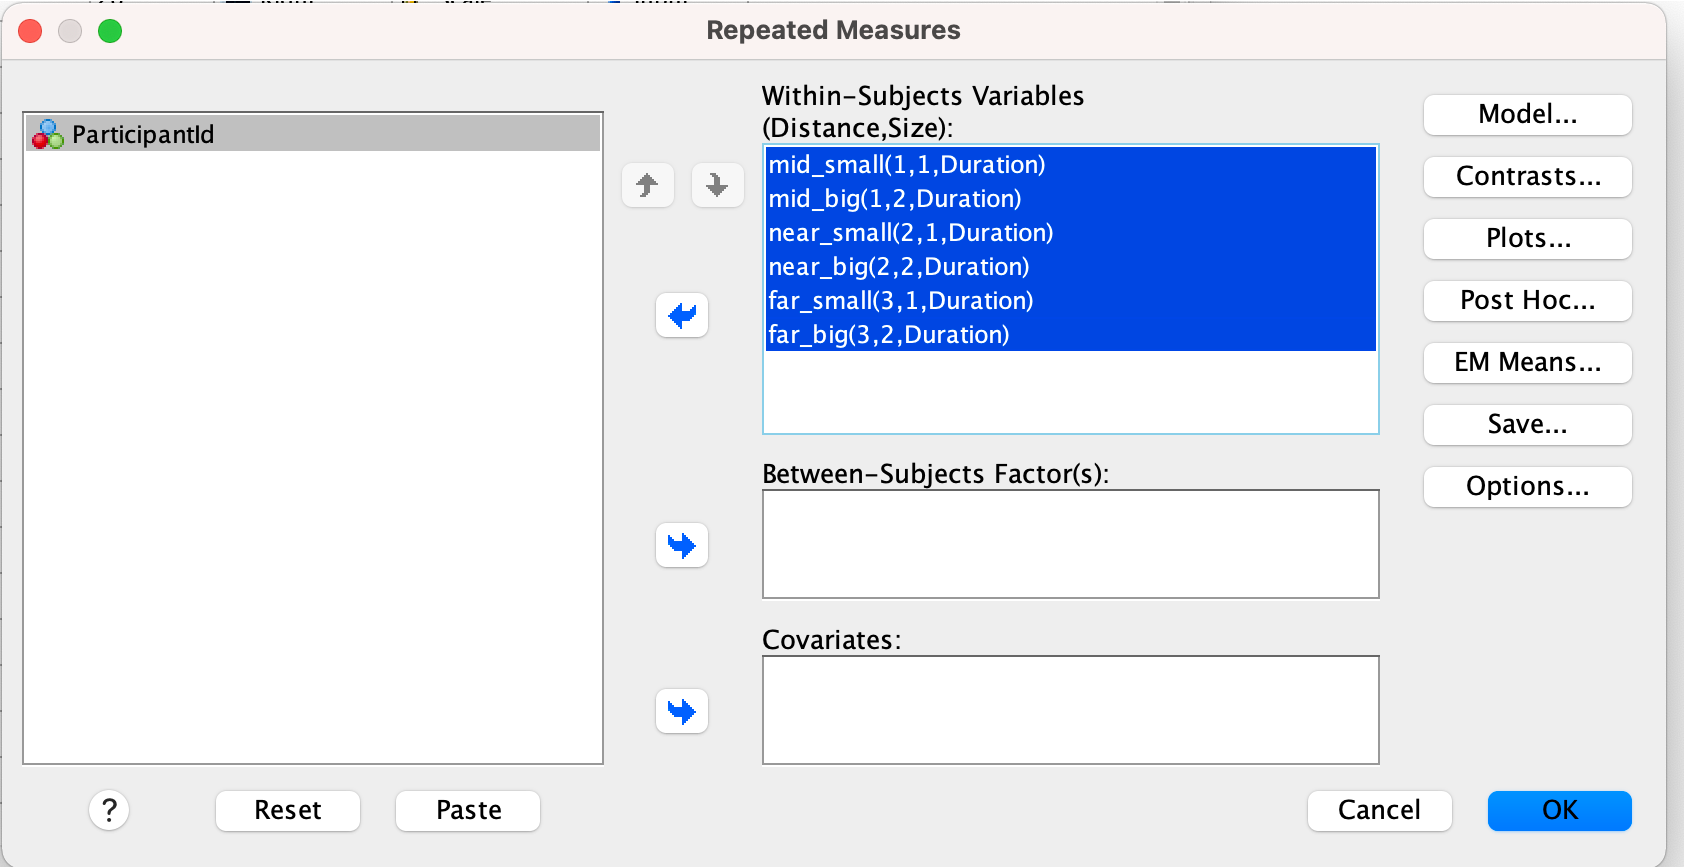
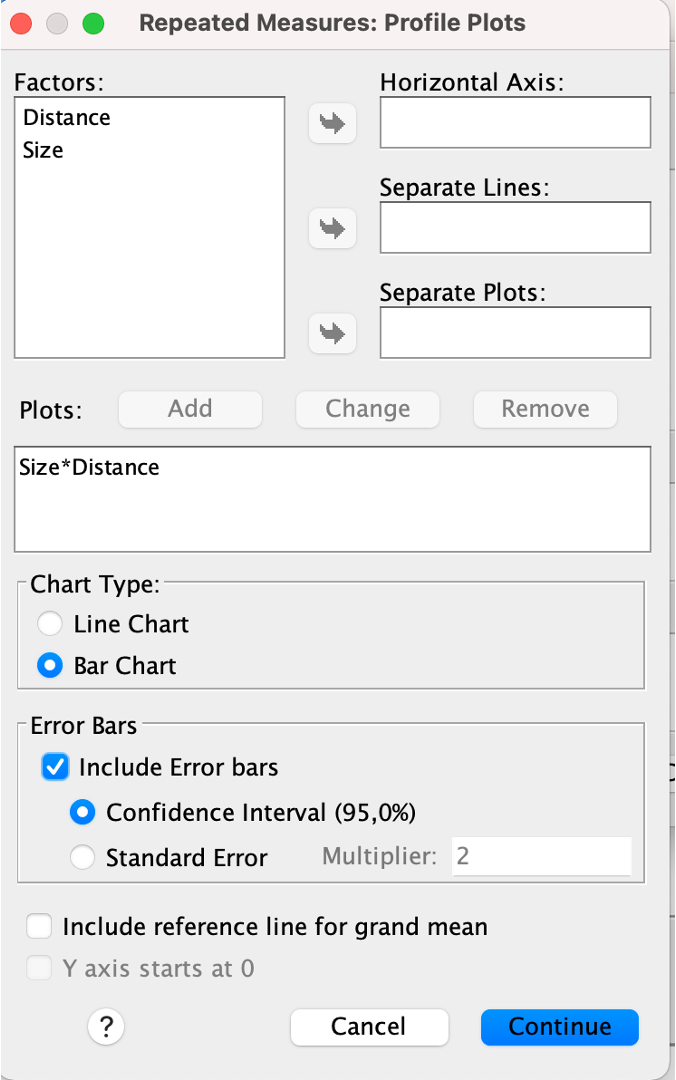
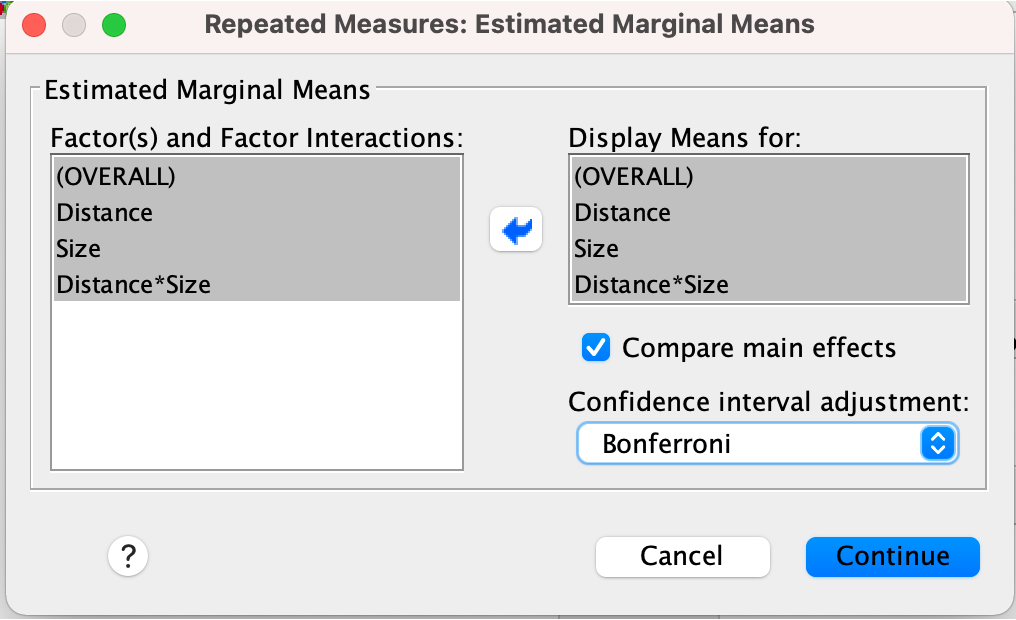
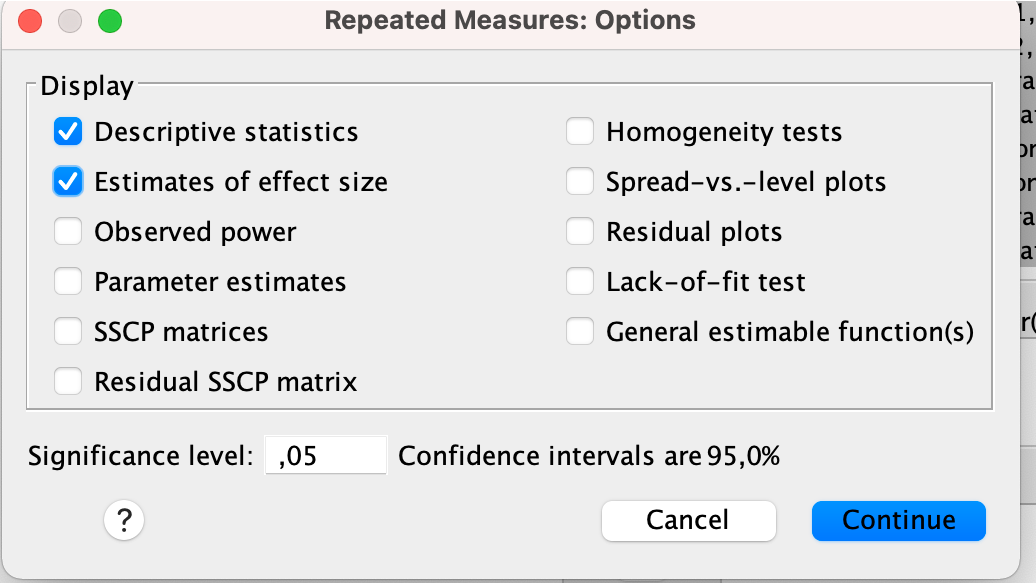
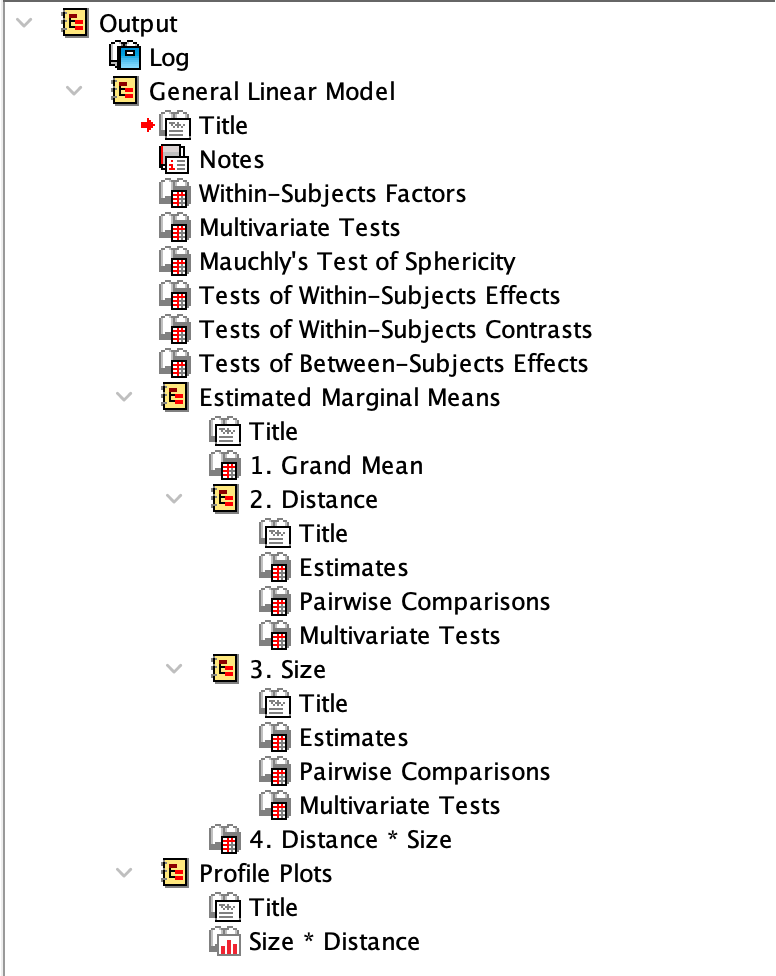
Workflow in SPSS
Given such a table, we can run the ANOVA-RM in SPSS as follows:
Interpretation
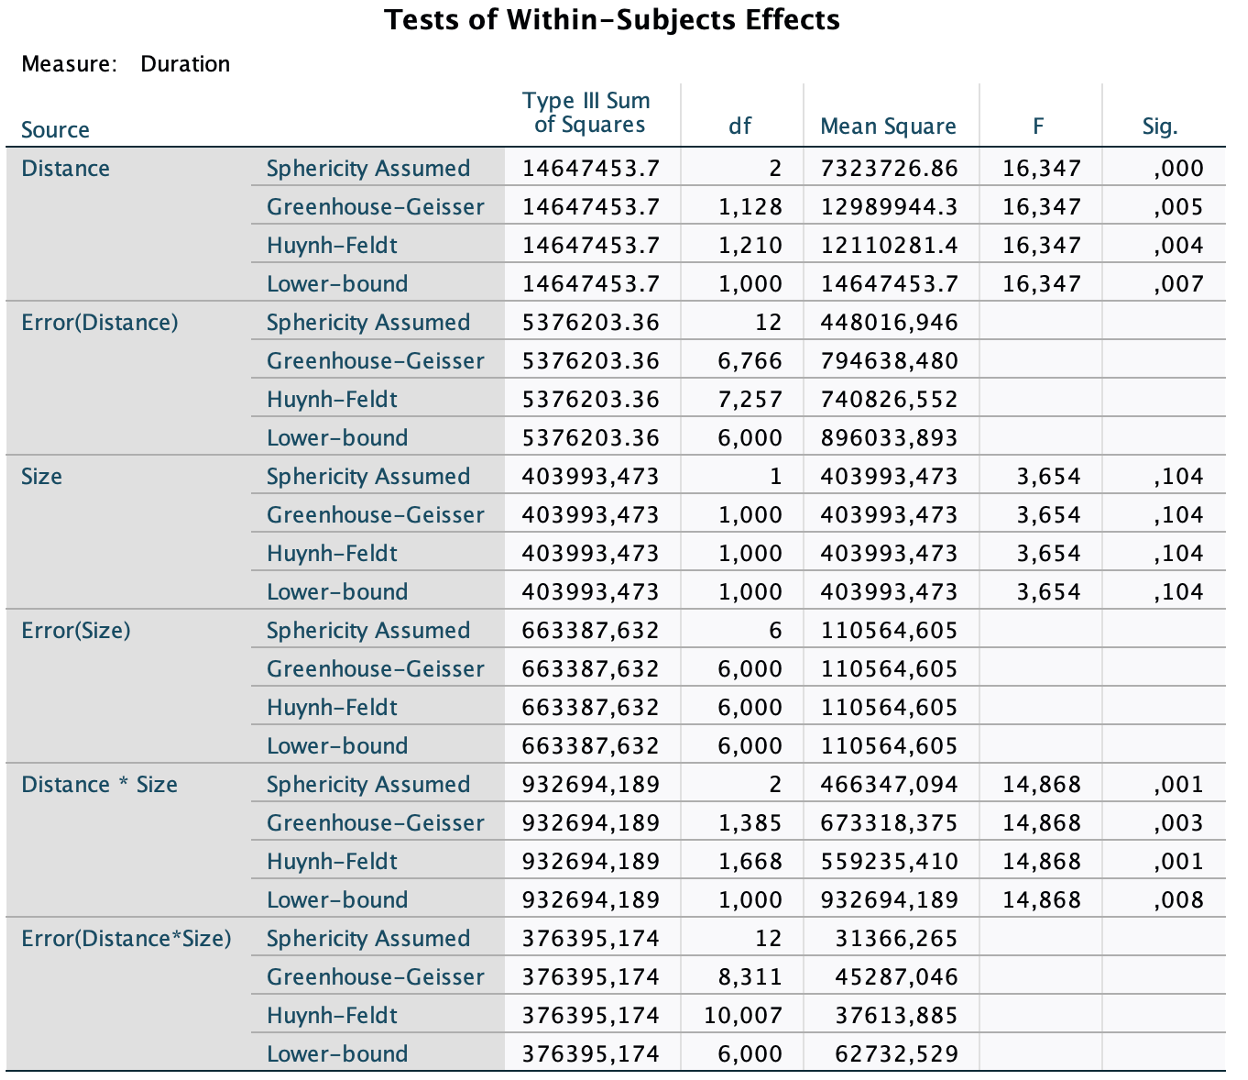
In the within-subject effects, we report the F-value with an index, composited from the the degrees of freedom n-1, where n is the number of factors, and the degrees of freedom in the error term. The degrees of freedom in the error term are generally given by the number of observations, decremented by the number of degrees of freedorm (i. e. number of levels minus 1). As numbers of observations, we consider the degrees of freedom per subject, i. e.:
- dof_model = dof_1 = number of levels - 1
- dof_error = dof_2 = (dof_1 * n_participants) - dof_1
Then, we report F_(dof_model, dof_error) as the F-value.
Running a Multi-Factor ANOVA in Python
SciPy, StatsModels, scikit-posthoc all offer certain capabilities to run a repeated-measured ANOVA, however I have found pingouin to offer the richest output while still only requiring one-liners:
With pingouin, we achieve the same results as in SPSS with the following script:
import pandas as pd
import pingouin as pg
from pingouin import pairwise_ttests

def run():
    df = pd.read_csv("long-table.csv", sep=",")

    anova_results = pg.rm_anova(data=df, dv="Duration", subject="ParticipantId", within=["Distance", "Size"], detailed=True)
    pairwise_results = pairwise_ttests(dv='Duration', within="Distance", subject='ParticipantId', data=df, padjust="bonf")

    print(anova_results)
    print(pairwise_results)


if __name__ == "__main__":
    run()
➜ within-subject-anova git:(main) ✗ python3 anovarm.py
Source SS ddof1 ddof2 MS F p-unc p-GG-corr np2 eps
0 Distance 1.464745e+07 2 12 7.323727e+06 16.346986 0.000375 0.004655 0.731507 0.56380
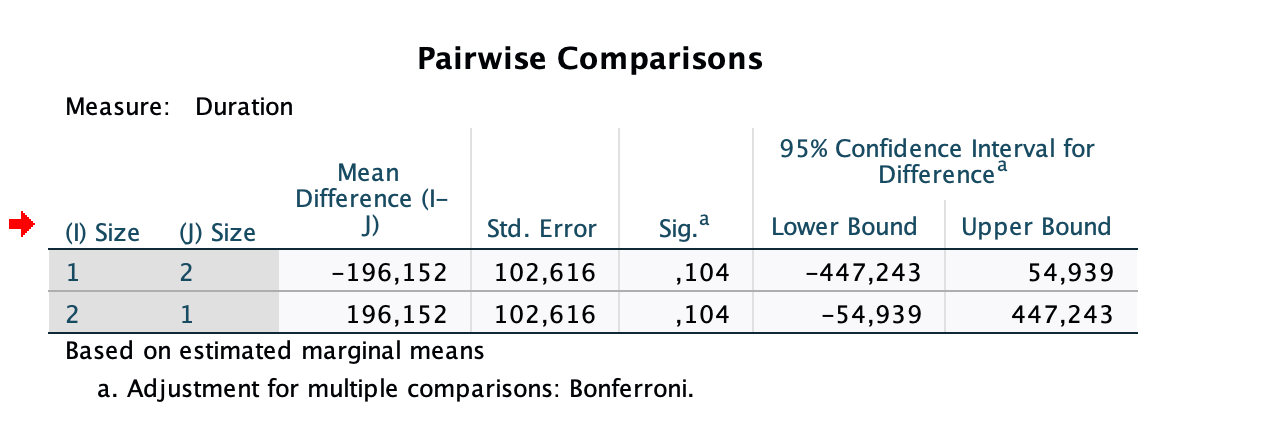
1 Size 4.039935e+05 1 6 4.039935e+05 3.653913 0.104487 0.104487 0.378490 1.00000
2 Distance * Size 9.326942e+05 2 12 4.663471e+05 14.867792 0.000565 0.002935 0.712476 0.69261
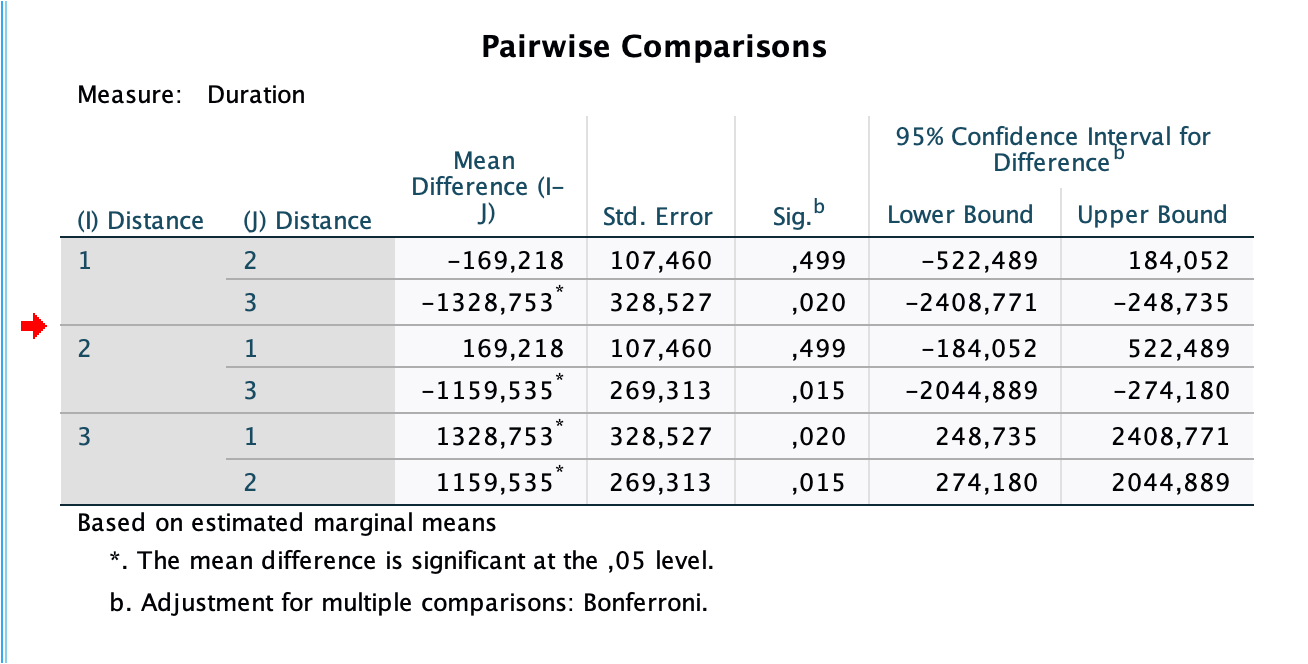
Contrast A B Paired Parametric T dof alternative p-unc p-corr p-adjust BF10 hedges
0 Distance far mid True True 4.044577 6.0 two-sided 0.006768 0.020303 bonf 9.087 1.810697
1 Distance far near True True 4.305526 6.0 two-sided 0.005062 0.015186 bonf 11.393 1.574290
2 Distance mid near True True -1.574709 6.0 two-sided 0.166391 0.499173 bonf 0.843 -0.543070